Search
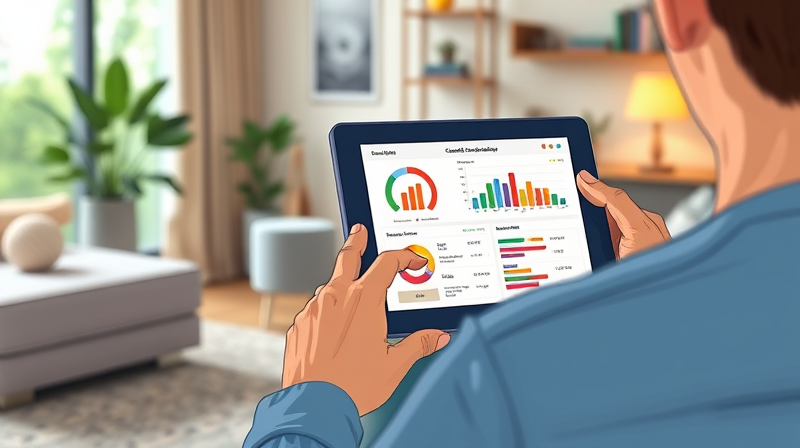
Tracking personal finances often feels overwhelming when numbers are scattered across spreadsheets, bank portals, and budgeting apps. What if you could bring all that data into one place, transform it into vibrant charts, and rearrange the view with a simple drag-and-drop?
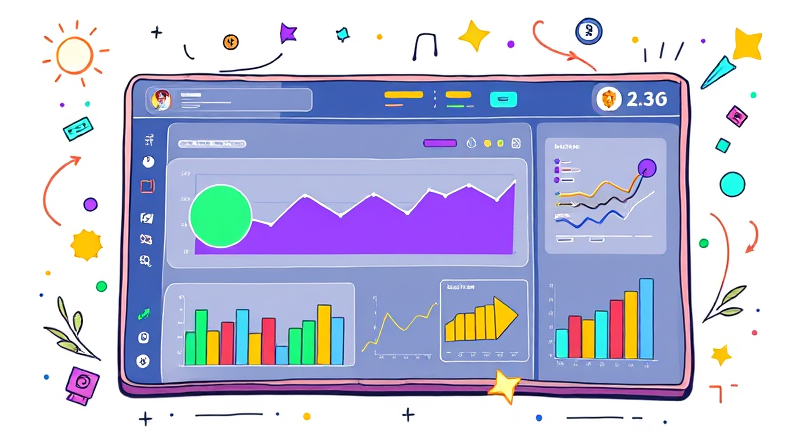
With a well-crafted financial dashboard, you gain both clarity and motivation. You see exactly where you stand, observe trends as they unfold, and make decisions grounded in real-time insights rather than guesswork.
The human brain processes over 90% of information visually, so turning raw numbers into graphics unlocks deeper understanding. A single glance at a pie chart or line graph can reveal trends spreadsheets might obscure.
By embracing real-time consolidated view of metrics you sharpen your awareness of cash flow, asset allocation, and debt levels. This visual clarity of cash flow and trends empowers better choices and more consistent progress.
Moreover, seeing your progress mapped out, from net worth growth to expense reduction, fuels a positive feedback loop. Each upward tick motivates you to stay on track and celebrate small wins.
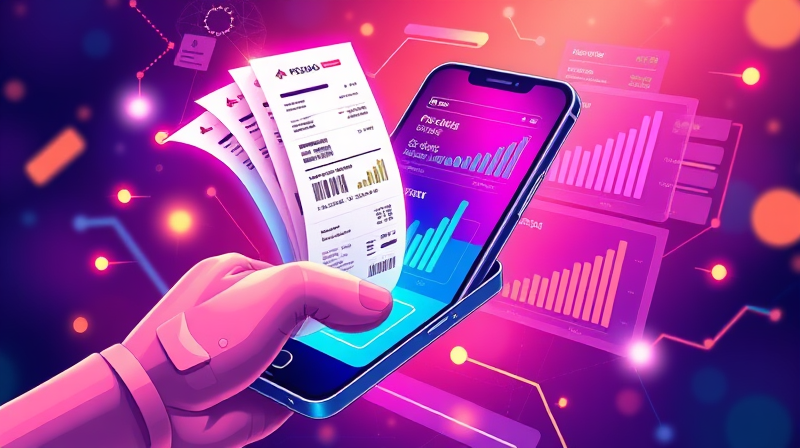
Modern dashboards leverage intuitive drag-and-drop interface designs that require no coding skills. You simply select, move, and resize widgets—such as charts, progress meters, and transaction feeds—until the view suits your personal style and goals.
Under the hood, these tools connect to your accounts via secure APIs or manual uploads, automate transaction categorization, and refresh data continuously. A powerful no-code customization approach means everyone, from beginners to finance pros, can tailor their dashboard without writing a single line of code.
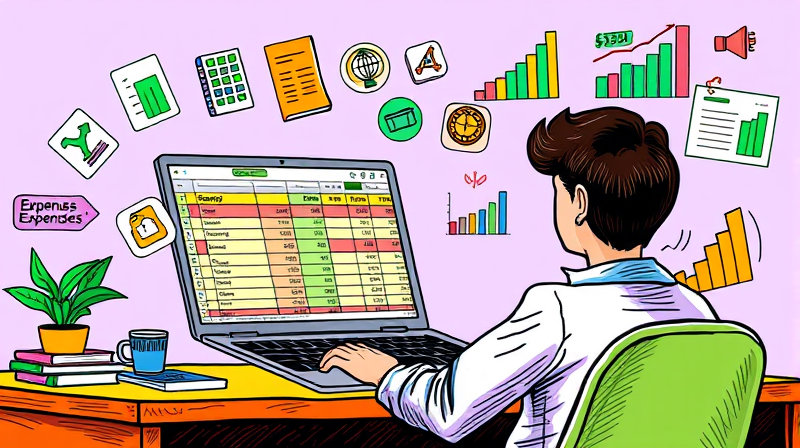
After defining your goals and compiling data, spend time exploring widget options. Some dashboards offer gauges for emergency fund progress, while others let you drill into spending categories. Mixing several visualization types keeps the interface engaging.
Once your widgets are in place, set up alerts for upcoming bills, unusual transactions, or when you reach a milestone. These reminders help you stay proactive and avoid late fees or forgotten savings targets.
Finally, make it a habit: review your dashboard daily or weekly, adjusting goals and layouts as your financial situation evolves. This ongoing interaction cements positive habits and deepens your financial insight.
This table highlights the comprehensive essential feature set that empowers you to track every facet of your finances with precision.
In recent years, designers have embraced mobile-responsive layouts for on-the-go updates so you can check your dashboard anywhere. Consistency in color palettes and typography fosters readability and trust.
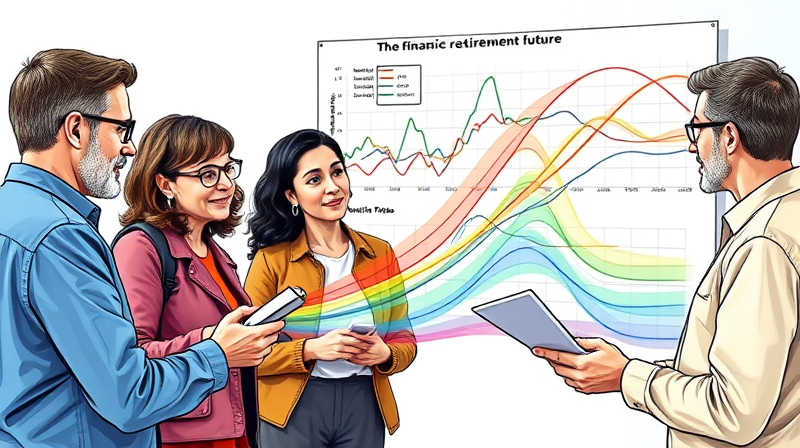
Community-shared templates on platforms like Dribbble showcase creative approaches—from minimalist grid designs to bold, data-centric visuals. Adapting these ideas can spark inspiration for your own interface.
When creating your dashboard, focus on clear and thoughtful visual hierarchy and balance. Prioritize the widgets that matter most and group related metrics together to avoid clutter.
While customization and visualization are exciting, safeguarding your data is paramount. Choose platforms with robust end-to-end encryption and authentication to keep your information secure both at rest and in transit.
Review privacy policies to ensure your financial details aren’t shared or sold. For added peace of mind, some users prefer desktop-based tools or local Excel templates that never connect to the cloud.
Accessibility features—such as color-blind friendly palettes, adjustable font sizes, and screen-reader compatibility—ensure that everyone can benefit from your dashboard’s insights.
Transforming abstract numbers into interactive visuals brings your net worth to life. A drag-and-drop dashboard offers tangible insights and motivation for goal achievement, guiding every financial decision with clarity.
By following the steps above—defining goals, gathering data, choosing the right tool, and customizing your view—you create a living interface that evolves with you. Regular interaction cements new habits and celebrates each milestone visually.
Embrace the power of dynamic interactive visual tracking tools today, and watch how an engaging, personalized dashboard can accelerate your path to greater wealth, confidence, and financial freedom.
References