Search
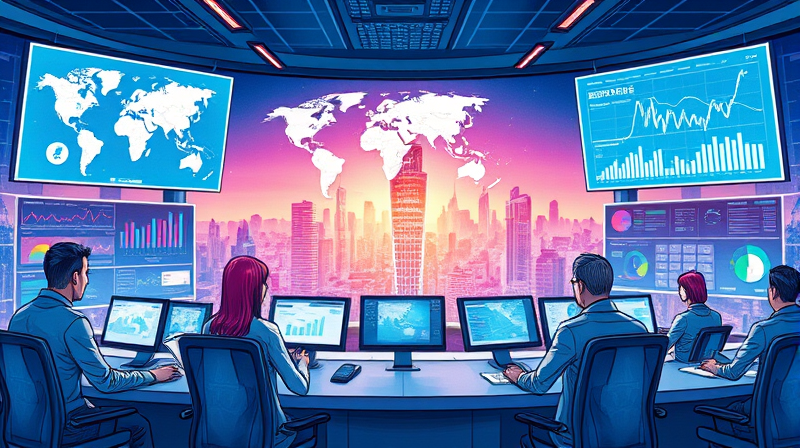
In an era defined by rapid market shifts and unpredictable policy changes, staying informed is no longer optional—it’s essential. Stakeholders across government, finance, and industry now demand access to a real-time pulse of global trends that empowers them to anticipate risks, seize opportunities, and craft resilient strategies.
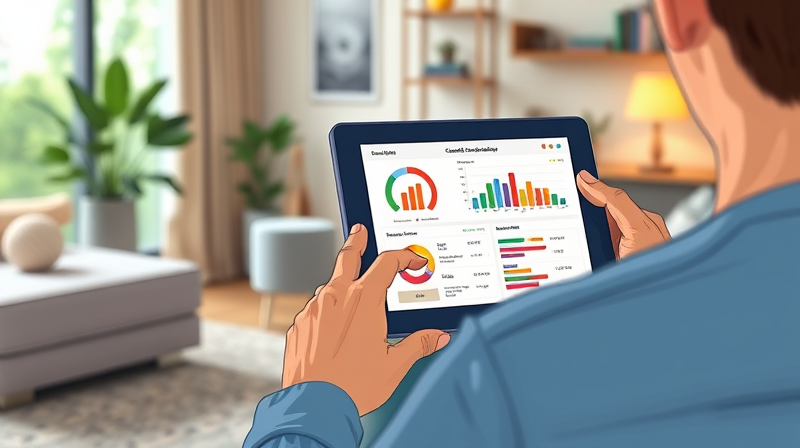
Imagine being able to glance at one screen and see how GDP, inflation rates, and trade balances are moving across continents in real time. This level of oversight transforms data from static footnotes into a dynamic narrative, guiding decisions with unprecedented clarity and speed.
Dashboards distill vast datasets into actionable intelligence. By aggregating diverse metrics into a unified interface, they offer users a holistic view of the global economy, updated as frequently as every hour or day.
By leveraging near real time updates with customizable alerts, professionals can react swiftly to emerging patterns, ensuring that critical decisions are driven by the latest data rather than outdated reports.
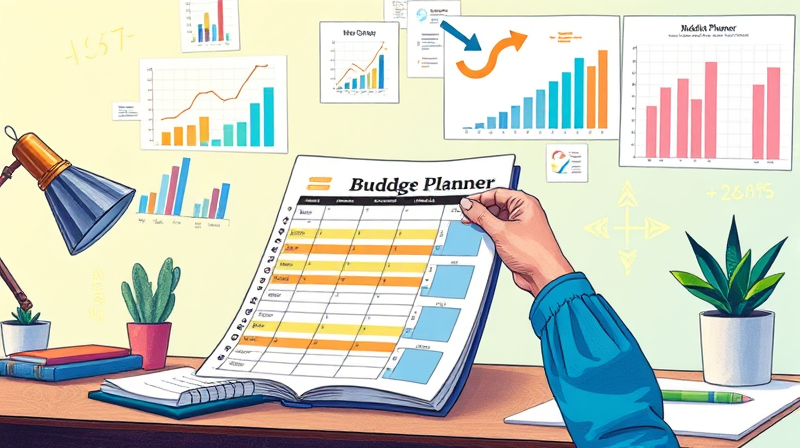
Every dashboard begins with a carefully selected portfolio of metrics. Core indicators include:
Supplementary indicators, such as stock market indices and sectoral trends (construction, investment flows), enrich the narrative, offering both leading and lagging perspectives.
To interpret dashboard data effectively, users must differentiate between leading, lagging, and coincident indicators. Leading indicators forecast the future direction of the economy, lagging indicators confirm trends after they occur, and coincident indicators move in tandem with the broader economy.
Arming yourself with this taxonomy enables more nuanced analysis, ensuring that short-term noise doesn’t obscure long-term signals.
Several world-class platforms power these dynamic views:
The IMF Datamapper features an intuitive interface for exploring real GDP growth and projections. The World Bank World Development Indicators dashboard offers deep customization, allowing users to craft bespoke analytics for each economy—from per capita measures to sector splits. The OECD Short-Term Indicators Dashboard delivers bi-weekly updates on G20 trends, facilitating interactive charts and map-based views that simplify cross-country comparisons.
Consider three of the world’s largest economies in 2025:
• The United States, with GDP growth moderating to 1.6%, balancing fiscal stimulus against tighter monetary conditions. • The Euro Area, facing headwinds at 1.0% growth amid lingering energy concerns. • China, projected to expand by 4.7%, navigating trade tensions while shifting toward domestic consumption.
By examining these diverse trajectories in parallel, policymakers and investors can identify converging risks—such as supply chain disruptions—and pinpoint regions of resilience.
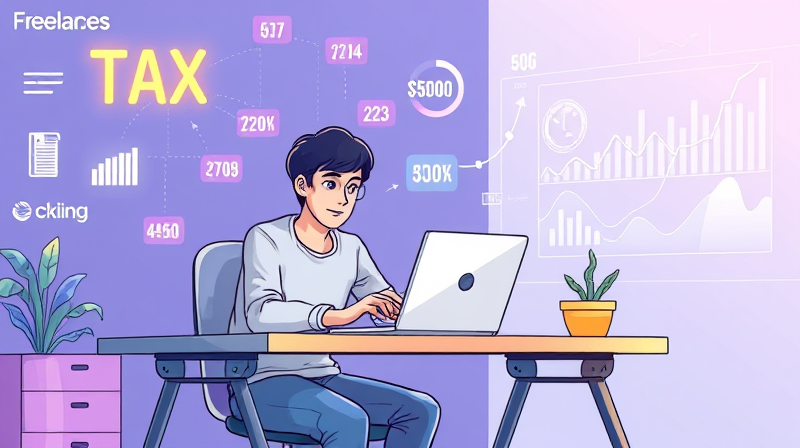
Global growth is forecast to decelerate from 3.3% in 2024 to 2.9% in both 2025 and 2026. Inflation in the G20 is expected to ease from 6.2% to 3.6% next year, yet tariff-driven price pressures may persist.
Key downside risks include escalating trade wars, tighter global financing conditions, and policy missteps. On the upside, coordinated fiscal incentives and labor-market reforms could buoy growth prospects, especially in emerging markets.
Leading organizations harness dashboards for scenario planning and policy simulations, stress-testing economies under alternative inflation, tariff, and growth assumptions. Coupled with comprehensive international benchmarking frameworks, these simulations feed into robust contingency plans, helping teams pivot instantly when indicators breach critical thresholds.
Creating a single source of truth for global economic data is more than a convenience—it’s a strategic imperative. By centralizing metrics, empowering custom views, and automating alerts, you enable timely data-driven decision making that can spell the difference between seizing an opportunity and chasing a lagging trend.
Whether you’re a policy advisor, corporate strategist, or institutional investor, the next frontier of economic intelligence lies in dashboards that blend robust source data with agile visualization tools. Embrace this technology to stay ahead in a world where information moves at the speed of light.
With the right dashboard in hand, you’ll not only monitor global indicators—you’ll master them.
References