Search
Tracking expenses accurately is the foundation of strong financial planning.
Exporting transactions with categories illuminates habits and trends hidden in raw numbers.
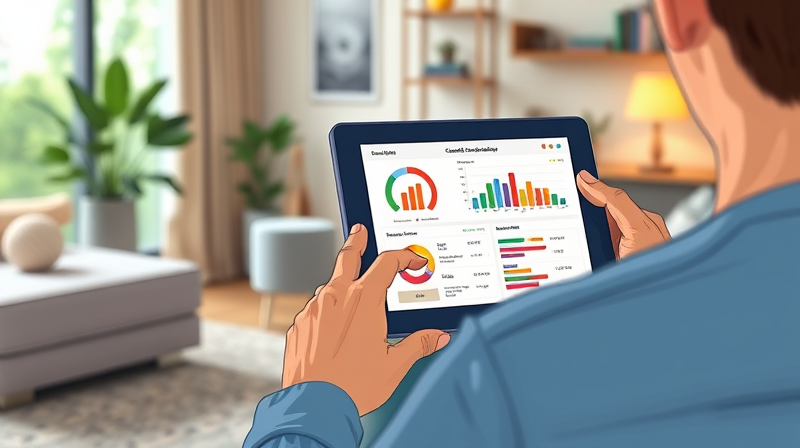
With clear, organized financial views, you can pinpoint areas of overspending and opportunities to save. A categorized spreadsheet offers personalized and in-depth tracking so you can see exactly where every dollar goes. It also fosters collaboration with accountants or team members, making joint financial management seamless.
By harnessing data in spreadsheets, it’s easier to build compelling visual reports using pivot tables and charts that drive smart decisions and maintain accountability.
There are three primary ways to get your spending data into a spreadsheet: manual exports, dedicated finance software, and automated integrations.
Each method carries unique advantages depending on how hands-on you want to be. Below is an overview of each approach.
Manual Export involves logging into your banking or credit card account, locating the “Download” or “Export” option, selecting CSV or Excel format, and then importing the file into Excel or Google Sheets. This method is universal, requires no additional software, and grants full control over the raw data.
Accounting Software like QuickBooks Online streamlines exports by letting you run category-filtered reports such as “Transaction Detail by Account,” then export to Excel. It’s ideal for small businesses or freelancers who already maintain digital ledgers.
Automated Tools such as Tiller Money connect directly to multiple accounts and push updated transactions into prebuilt spreadsheet templates. With features like AutoCat rules, they can reduce manual data-entry time by up to 80%.
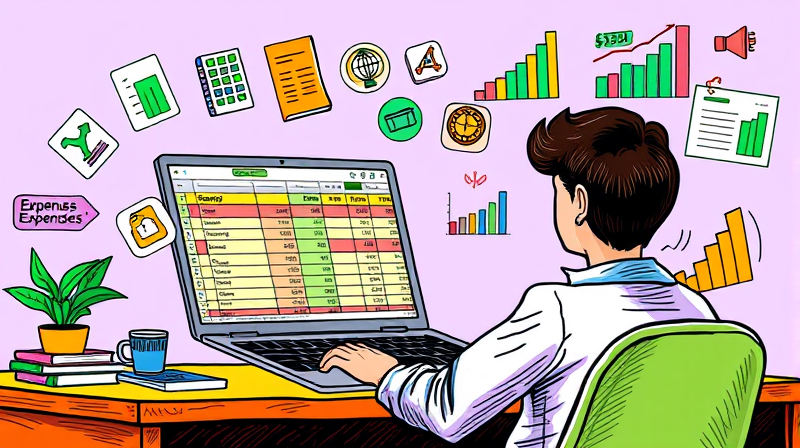
Building a well-structured spreadsheet is crucial for long-term clarity and usability. Begin by creating key columns for every transaction.
Define your categories to capture all areas of spending. Start broad, then refine:
As you analyze trends, you can split categories further (for example, breaking “Food” into groceries versus restaurants).
Effective categorization transforms raw data into insights. After importing, review untagged transactions and assign categories. Automated tools can handle the bulk of this work by applying predefined rules to match descriptions with categories.
Regularly auditing your category assignments ensures accuracy and consistency. If you notice patterns of misclassification, update your rules or add new categories to reflect unique spending types.
Once your data is categorized, it’s time to analyze. Pivot tables in Excel or Google Sheets allow you to aggregate spending by category, month, or vendor in seconds.
Formulas like SUMIF or SUMIFS can create dynamic summary tables. For instance, use =SUMIF(CategoryRange, "Food", AmountRange) to calculate total food spending. Pair these calculations with charts to visualize trends over time.
Comparing budgeted versus actual expenses side by side highlights deviations. Creating a separate column for your budgeted amount and then calculating variance helps you stay on track:
Variance = Actual – Budget
By tracking variance monthly, you can adjust future budgets or spending behaviors proactively.
By following these best practices, you’ll develop a disciplined routine for budget management and financial planning.
Your choice depends on your technical comfort level and the complexity of your finances. New users might prefer manual exports with simple spreadsheets. Seasoned users overseeing multiple accounts could benefit from platforms like Tiller Money or enterprise accounting software.
Consider starting with free templates from providers like Tiller, Shoeboxed, or Smartsheet. These often include built-in dashboards and sample categories to accelerate your setup.
Exporting your spending by category into spreadsheets empowers you with actionable financial insights that drive better money decisions. Whether you opt for a manual CSV download, leverage accounting software, or automate with dedicated tools, the process remains accessible and customizable.
By structuring your data, categorizing transactions accurately, and applying best practices, you’ll unlock the power of detailed analysis. Start today to gain a clear, organized view of your finances, identify savings opportunities, and achieve your financial goals with confidence.
Embrace these workflows and transform raw transaction lists into a roadmap for sustained financial health.
References